
How data streaming powers real-time AI predictions
A journey building the data infrastructure for an AI data pipeline, from managing Kafka message durability to deploying a K-Means clustering model with BigQuery ML.

Many thanks to my big data professor at Sorbonne University, Ibrahima Diattara, for his excellent course and for suggesting this very project.
Content
The AI model works. Now what?
You open a ride-hailing app like Uber, enter your destination, and in less than a second, a price appears. It feels like magic, but it’s not. In that instant, the app didn’t just multiply distance by a flat rate. It likely executed a real-time AI model that analyzed your precise location, placing you in a dynamic geographic zone the model learned on its own, and then calculated a price based on demand, driver availability, and traffic within that specific zone.
As a product manager, getting a data scientist to build that pricing model in a notebook is the easy part. The real challenge, the one that separates successful AI products from forgotten science projects, is answering the questions: “How do we deploy this model so it can make millions of predictions a day, in real-time, without failing? How do you build the industrial-grade platform required to serve an AI feature at scale?”
That challenge is what this project is all about: bridging the gap between a data scientist’s notebook and a scalable, production-ready AI feature. This playbook documents my journey building the industrial-grade data platform required to power a real-time AI feature, step-by-step.
By the end of this article, you’ll be able to confidently lead a technical discussion on how to deploy real-time AI. You will understand the architectural patterns, the critical trade-offs between different tools, and be equipped to ask the right questions to ensure your AI feature doesn’t just work in a lab, but thrives in production.
This is a hands-on journey, and I’m sharing all the assets:
The journey will unfold in three acts:
Act I, the briefing: Deconstructing the real-time AI stack. Before we build, we must understand. We’ll use simple, powerful analogies to decode the essential tools that power a platform.
Act II, the mission: Building the ride-hailing analytics MVP. We’ll frame the technical challenge as a product mission and then build the platform, iteration by iteration, from a simple message pipe to a sophisticated, multi-destination pipeline.
Iteration 1, the “tracer bullet:” Establishing the data flow. The first step is to build the simplest thing that could possibly work: a single pipe to get data from a producer into Kafka.
Iteration 2, the enrichment: Adding business logic. With data flowing, we’ll introduce our first Airflow pipeline to add value by calculating the trip’s distance and cost.
Iteration 3, the fan-out: Serving different user needs. We’ll build the second pipeline that splits the data stream, sending it to two different destinations to serve two distinct user personas.
Iteration 4, the activation: Deploying the AI model. Finally, we’ll connect the data pipeline to the pre-trained BigQuery ML model to generate real-time predictions.
Act III, the debrief: From black box to business insights. We’ll go beyond just looking at the results. We’ll peek inside the “black box” of the machine learning model and distill the entire journey into actionable lessons for product leadership.
Ready to open the black box of real-time AI?
Act I: Deconstructing the real-time AI stack
Before we start building, we need to understand our tools. A product manager doesn’t need to be a master coder, but they must understand the function and purpose of each component in their technical stack. Think of this as the pre-mission briefing.
For those who prefer to listen, I’ve created with NotebookLM a 15-minute audio overview that dives into these concepts in a podcast style. You’ll get to be a fly on the wall for a conversation between two virtual people who actually enjoy talking about this stuff. It’s a great way to get a high-level feel for how these tools interact before we dive into the details below.
Data streaming: The river vs. the lake
In the world of data, there are two fundamental ways to handle information. Batch processing is like a lake: you collect data over a period (a day, a week) and then run a large, scheduled process on the entire “lake” of data at once. This is great for end-of-month reports but is far too slow for a live application where users expect immediate feedback.
The ride-hailing app needs stream processing, which is like a river. Data flows continuously as a series of individual events (a trip request, a price calculation). We don’t wait to process it; we act on it the moment it arrives. For a real-time AI feature, you must build on a river, not a lake.
Kafka: The digital nervous system
Apache Kafka is the circulatory system of a platform, a distributed, open-source streaming platform originally created at LinkedIn to handle their immense data flows. It’s designed from the ground up for real-time data pipelines.
Think of Kafka as the digital nervous system of an application. In the old days, applications were connected point-to-point, creating a brittle “spaghetti architecture” that was impossible to scale. Kafka introduces a “bus” architecture where applications are decoupled. Messages (events) are like nerve signals that travel through dedicated pathways called Topics.
For our project, the producer.py script sends a “trip request” signal down the topic_source nerve, and the Airflow application receives it for processing. This system ensures that no signal is ever lost and that messages are delivered reliably, even if one part of the system temporarily fails.
This resilience is achieved through partitions and replication. Partitions are “the engine,” allowing data to be processed in parallel to achieve massive throughput, millions of messages per second isn’t just hype. Replication creates copies of those partitions on different servers (brokers), so if one server fails, a replica instantly takes over and the data stream keeps flowing.
As a product manager, two key Kafka features directly impact your product’s behavior.
The first is message ordering. If you need to guarantee that all events from a single user are processed in the exact order they occurred, you can assign a “key” (like a
userID) to each message. Kafka ensures all messages with the same key land in the same partition, preserving order. However, this comes with a trade-off: if one user becomes hyperactive, their dedicated partition can become a “hotspot,” creating a bottleneck.The second feature is durability, controlled by the
ackssetting. This is a core product decision that balances speed versus safety. Settingacks=0is “fire and forget,” fast but risky, good for non-critical logs. Settingacks=allis the safest option, as the system waits for the message to be fully replicated before confirming it’s been sent. This guarantees no data loss but comes at the cost of higher latency, a classic trade-off you must manage.
Airflow: The orchestra conductor
Apache Airflow is the workflow orchestrator. It’s an open-source platform originally created at Airbnb to manage their complex data pipelines. It does not process any data itself; it tells other tools what to do and when to do it.
Think of Airflow as the conductor of our data orchestra. Our Python functions are the musicians. The conductor doesn’t play the violin; it tells the violinist when to play, ensuring the entire symphony is performed in perfect harmony.
While dedicated stream-processing engines like Apache Flink or Spark Streaming offer lower latency for true real-time applications, Airflow was the ideal choice for this MVP. Its powerful orchestration, scheduling, and monitoring capabilities were prioritized to reliably manage the entire end-to-end workflow, which was more critical for this project than achieving microsecond processing speeds.
In our project, workflows are defined as DAGs (Directed Acyclic Graphs). Airflow tells one task in our DAG to consume data from Kafka, then tells the next task to calculate the price, and finally tells a third to publish the result, all in the correct sequence. It handles scheduling, retries on failure, and manages complex dependencies, making it the brain of our operation.
Its main alternative in the cloud is a managed service like Google Cloud Composer, which is, in fact, a managed version of Airflow.
Elasticsearch and Kibana: The live monitor
This is the real-time visualization layer, responsible for the operational dashboard. Both are part of the popular ELK Stack developed by the company Elastic.
Think of it like a high-tech security room. Elasticsearch is a search and analytics engine that instantly files and indexes every event (every trip) as it happens, optimized for lightning-fast retrieval. Kibana is the wall of monitors (the dashboard) that lets us see everything live. When we need to know what’s happening right now, we look at the Kibana monitor.
A critical concept for PMs here is the mapping, which is Elasticsearch’s schema. You must define your data types upfront, as changing them later is difficult. A common mistake is misconfiguring text fields. A field you want to aggregate on (like confort) must be mapped as a keyword type. If you map it as text, Elasticsearch will break it down into individual words for full-text search, and your charts grouping revenue by comfort level simply won’t work. Getting this right is crucial for the success of your analytics features.
GCS and BigQuery: The warehouse and the genius analyst
This is the analytics and machine learning layer, powered by Google Cloud Platform (GCP).
Google Cloud Storage (GCS) is the massive, low-cost warehouse where we store every trip record forever. It’s the data lake. As a PM, a key decision here is choosing the right storage class (Standard, Nearline, Coldline, or Archive) to optimize costs based on how frequently you need to access the data.
Living in this warehouse is BigQuery, the genius analyst. BigQuery is a serverless, petabyte-scale data warehouse that lets us run complex SQL queries over massive datasets. Its killer feature for AI products is BigQuery ML (BQML). It allows us to build and train machine learning models directly inside the warehouse using simple SQL commands. We don’t need to export data to a separate ML platform. We can ask it, “Analyze all our past trips and find the 8 most common geographic zones,” and it will build a K-Means model (ride_hailing_clusters) that can then categorize any new trip in real-time. This dramatically speeds up the iteration cycle for data-driven products.
Tying it all together: The story of a single trip request
So, how do all these pieces connect? Let’s follow the journey of one trip request:

A user requests a ride. A
producer.pyscript fires a JSON message into the Kafka Topic,topic_source. We’ve configured the producer withacks=allbecause we cannot afford to lose a single trip request.Airflow is constantly listening. Its first DAG,
dag_1_trip_processing, consumes the message. TheComputCostTraveltask calculates the distance and price, creating a new, “enriched” message. This enriched message is then published back to Kafka, into thetopic_resulttopic.This is where the “fan-out” happens. The second DAG,
dag_2_load_data, immediately consumes this enriched message fromtopic_resultand sends it down two parallel paths:Path A (the “now”): The data is sent to Elasticsearch. It’s indexed in milliseconds and instantly appears on our Kibana dashboard, giving the Operations team a live view of revenue and trip locations.
Path B (the “forever”): The same data is written as a JSON file to our Google Cloud Storage data lake, our cost-effective, long-term storage solution.
The moment the file lands in GCS, it becomes visible to BigQuery through our External Table. The final analytical query can now run, joining this new, live trip data with our pre-trained BigQuery ML model. The model assigns the trip to a geographic cluster, and the query calculates the final revenue report, providing the Strategy team with an up-to-the-second insight.
This entire journey, from user action to dual-system update, happens automatically, orchestrated by Airflow, demonstrating a complete, real-time data platform in action.
Act II, the mission: Building the ride-hailing analytics MVP
With the technical briefing complete, it’s time to put on our product manager hats. A data platform, like any product, should not be built for technology’s sake. It must solve real user problems. For this project, the “users” aren’t the riders or drivers, but the internal teams responsible for running and growing the business.
The product scenario
Imagine we are the product manager for a new ride-hailing startup. We’ve successfully launched our app, and trips are happening. We’re live, but we’re flying blind. Data is being generated, but it’s disappearing into a void, providing no immediate value back to the business.
The stakeholders have two critical, unanswered questions that are hindering the ability to operate and strategize effectively:
The Operations team’s problem (the “now”): “What is happening in our business right now? A customer is reporting an issue with their fare, can I see the details of that trip immediately? How much revenue are we generating from ‘High’ comfort rides in the last hour?”
Need: Real-time visibility. They need a live monitor, not a report from yesterday.
The Strategy team’s problem (the “why”): “Where are our most profitable trips happening geographically? Can we identify hidden ‘hotspots’ or zones that we didn’t know existed? How should we position drivers to optimize for future demand and maximize revenue?”
Need: Deep, analytical insight. They need the ability to sift through data, find patterns, and apply predictive models.
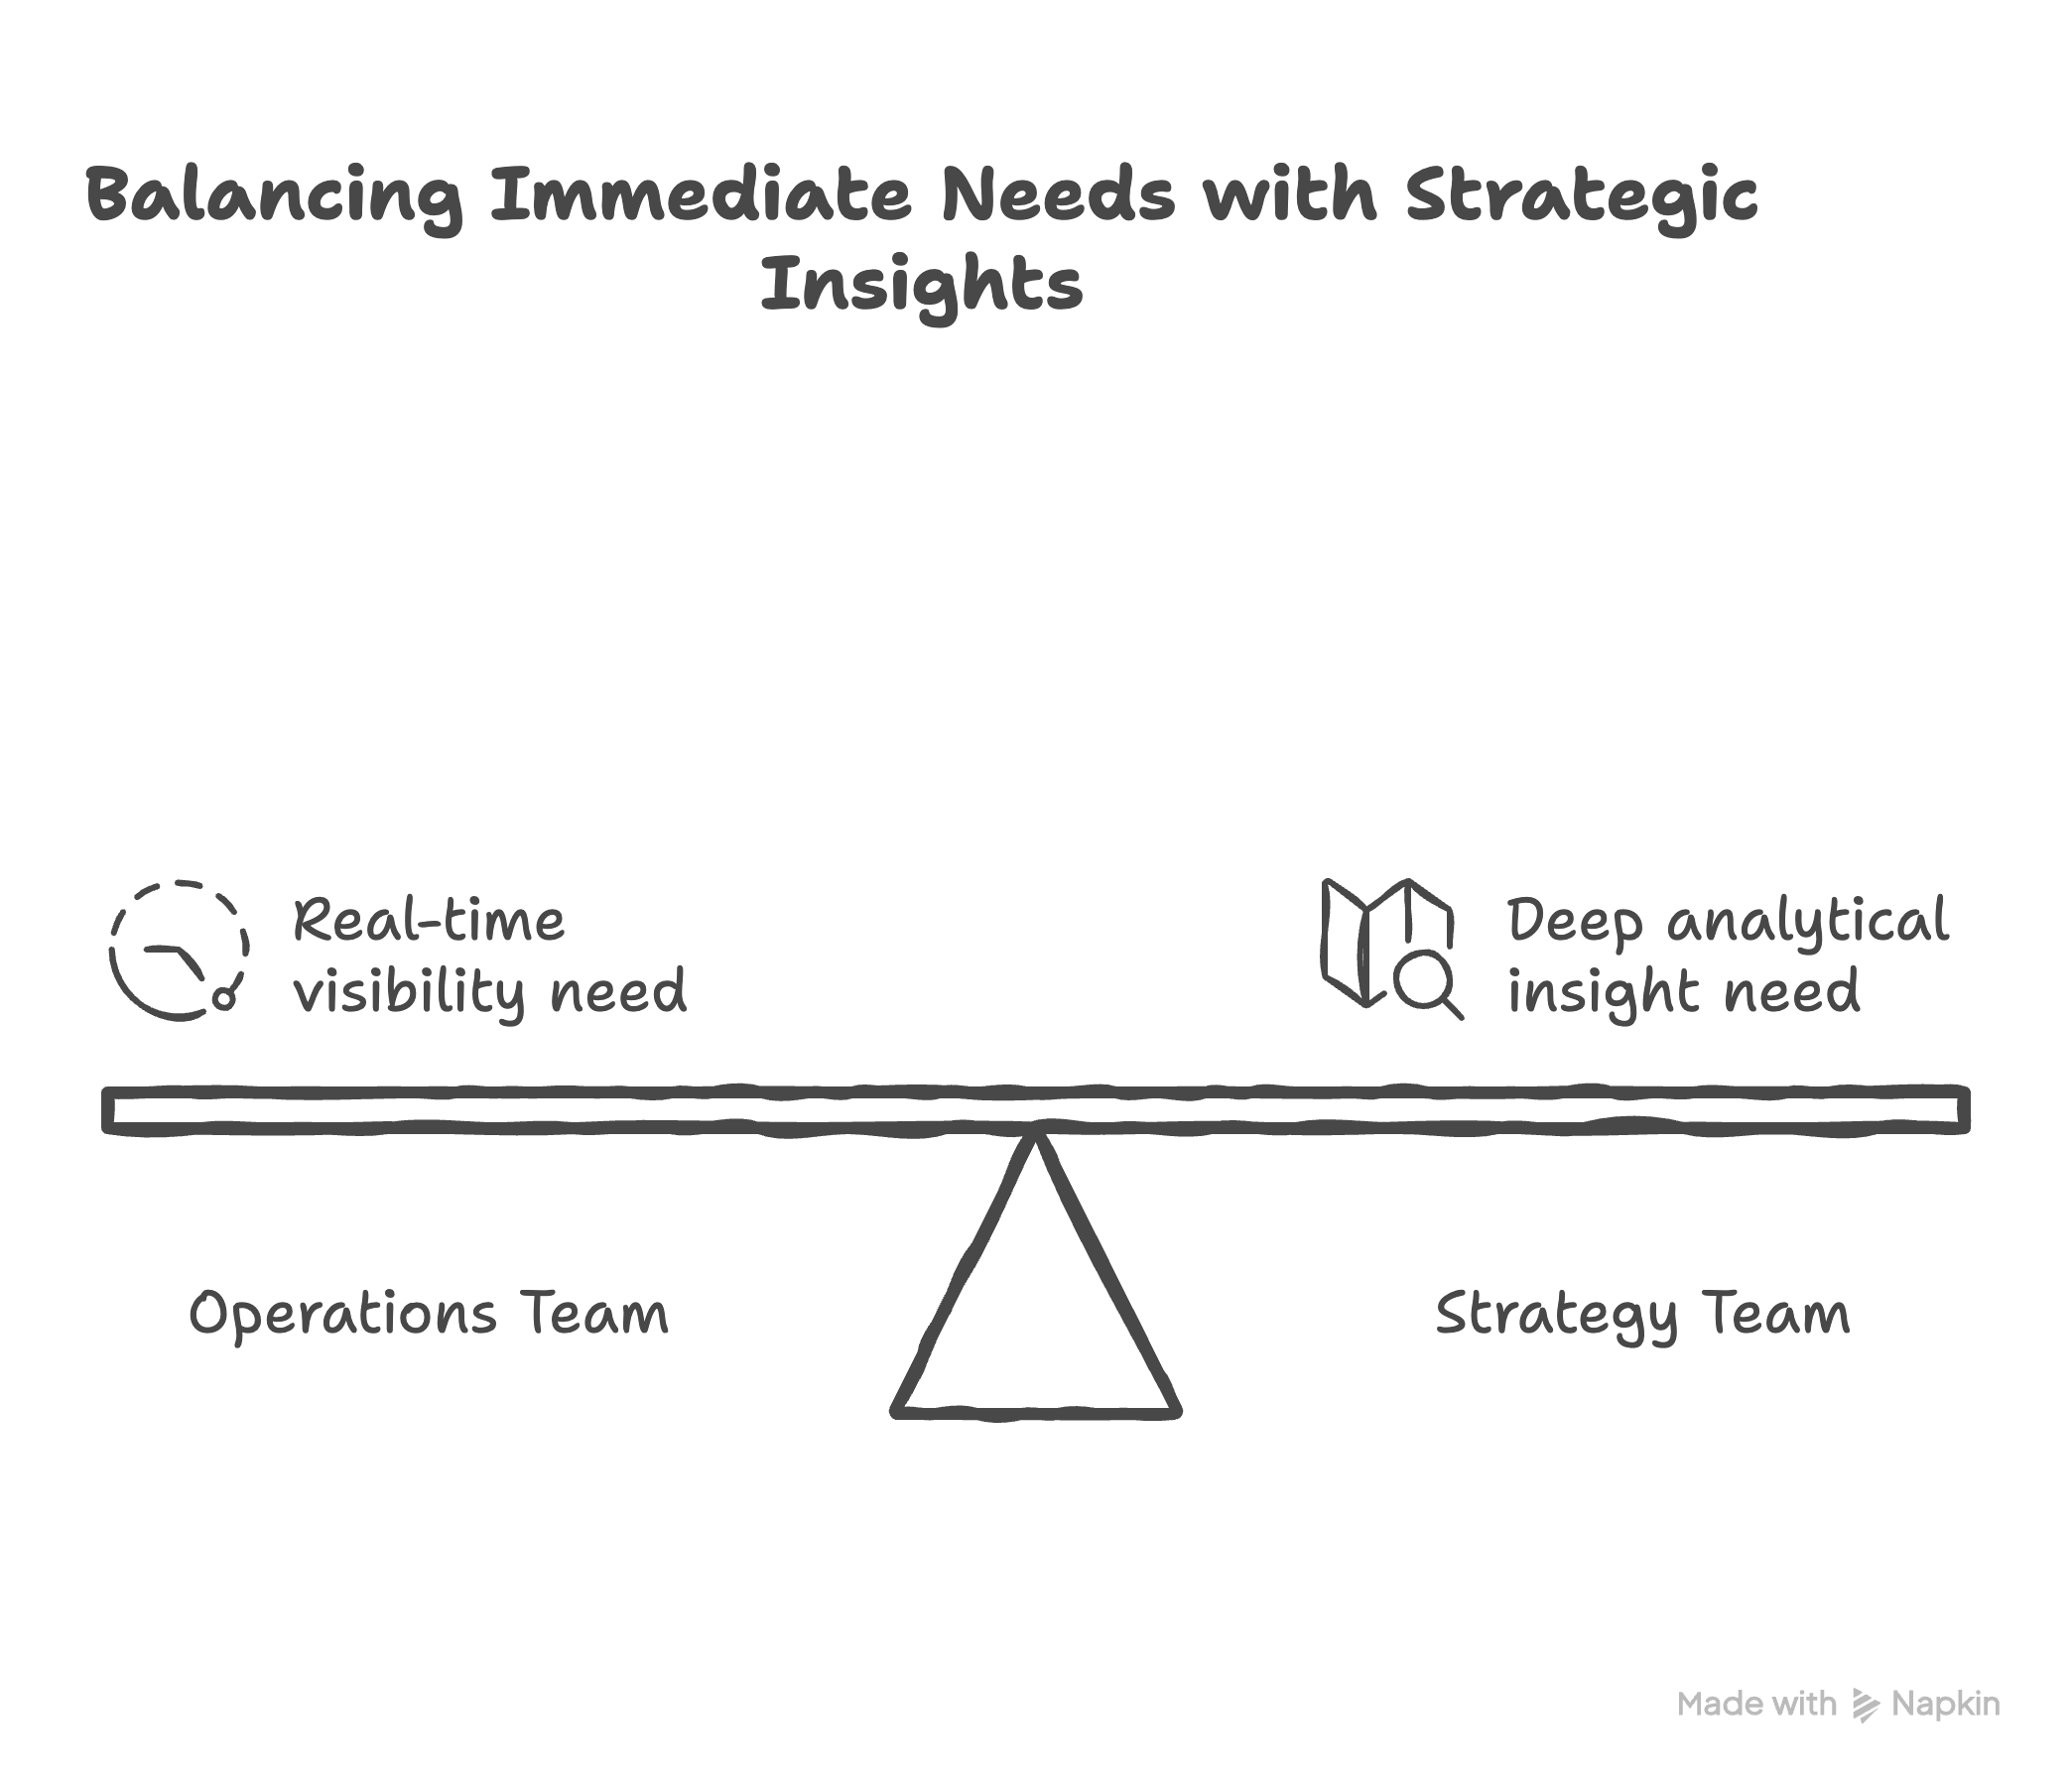
A single solution won’t solve both problems. The Ops team needs speed, while the Strategy team needs depth.
Our mission, therefore, is to build the Minimum Viable Data Platform to answer these two distinct user needs. The scope is clear: ingest a single stream of live trip data and build two separate data products from it:
A live operational dashboard to provide instant visibility.
A real-time analytical query powered by a machine learning model to uncover strategic insights.
With our mission defined, it’s time to build. We’ll approach this not as a single, monolithic task, but as a series of product iterations. Each iteration will build upon the last, adding value and de-risking the assumptions along the way.
Iteration 1, the “tracer bullet:” Establishing the data flow
Like any good MVP, we start with the simplest thing that could possibly work: sending one message from A to B. Before writing a single line of Python, the first step was setting up the local infrastructure using Docker.

docker-compose.yml file is the infrastructure-as-code. It defines the local Kafka and Elasticsearch services, ensuring a reproducible environment.With a single command (docker-compose up), all the services are running. With the infrastructure live, we can build the “tracer bullet” pipeline: a simple producer sending a message to a consumer.

As a PM, this step is the technical spike. Its “Definition of Done” isn’t a user-facing feature; it’s simply proving that a message can be sent and received. This de-risks the entire project’s foundation.
And, of course, it failed at first. My initial attempts were met with Connection Refused. This wasn’t a complex coding bug; my local Kafka container simply wasn’t running. This taught me Lesson #1: Always check your infrastructure first. It’s the equivalent of making sure the power is on before debugging the TV.
Iteration 2, the enrichment: Adding business logic (DAG 1)
Now that data is flowing, let’s make it useful. We introduce Airflow to create our first automated assembly line, dag_1_trip_processing.

Each step in a data pipeline should be like a feature: it takes an input and produces a more valuable output. Here, the ComputCostTravel task acts on the raw data, translating the business rule (price = distance * base rate) into technical logic. The output of this DAG is an “enriched” product, ready for the next stage. The proof is in the final message.

topic_result topic. As required, the message now contains the new distance and prix_travel fields. This proves our first data transformation was successful.Iteration 3, the fan-out: Serving different user needs (DAG 2)
The enriched data is ready, but the users have different needs. The Ops team needs speed for a live dashboard, and the Strategy team needs deep, cost-effective analytics. A single solution won’t work. This is product thinking applied to data architecture: we must build two different user experiences for our two distinct user personas.
We solve this with a “fan-out” architecture in dag_2_load_data.

transform_json task, the pipeline splits to load data into Elasticsearch and GCP in parallel.Let’s verify that the data landed correctly in both destinations.


Naturally, this also failed initially with a Permission ‘storage.objects.create’ denied error. This was a classic product integration problem: our service didn’t have the right credentials. It’s the data equivalent of a user logging in but not having permission to save their work. A quick change in GCP’s IAM settings fixed it, highlighting how crucial it is for PMs to understand the authentication and permission models of their tech stack.
Iteration 4, the activation: Deploying the AI model
Finally, we connect the data pipeline to the pre-trained BigQuery ML model to generate real-time predictions. As a PM, our role here is to define the business question the AI will answer: “Where are our most profitable geographic zones?” We specify the inputs the model needs and the output we expect, treating the model’s deployment as a core feature launch. The process was threefold:


Act III, the debrief: From black box to business insights
With the platform built and data flowing, it’s time for the final, most critical act: the debrief. This is where we move beyond the “how” and focus on the “so what?” We’ll look at the final products we created, peek inside the “black box” of our machine learning model to understand how it really works, and discuss the critical trade-offs that every product manager must navigate when building AI-powered systems.
The final products: Answering the users’ needs
The mission was to solve two distinct problems for two different user personas. The final deliverables directly address those needs.
For the Operations team, the live dashboard:

For the Strategy team: the analytical report:

Peeking inside the black box: What is our K-Means model actually doing?
The BigQuery result is impressive, but why does it work? The term “machine learning model” can feel like an intimidating black box. Let’s open it.
Think of the K-Means model as a smart sorting hat for locations. When we trained it on thousands of historical Uber trip locations, we didn’t tell it where “Downtown” or “The Suburbs” were. We simply asked it to find 8 distinct geographic groups on its own. The model analyzed the data and effectively drew 8 circles (or “clusters”) on the map, defining our core operational zones based on data, not assumptions.
When our final analytical query runs, it takes the latitude and longitude of a new, live trip from our pipeline and asks the model a simple question: “Which of your 8 circles does this new trip belong to?” The model instantly assigns the trip to a cluster_id (e.g., 2). The final query then uses this ID to group the revenue, allowing us to see which zones are the most profitable. We didn’t have to manually define any geographic boundaries, the model found the patterns for us.
Discussing the trade-offs: The PM’s real job
Every architectural decision comes with trade-offs. As PMs, understanding and articulating these is our core responsibility.
1. Real-time vs. batch (Elasticsearch vs. GCS): Why did we build two separate data paths?
This was a conscious product trade-off. Elasticsearch gives us sub-second query speed for our live Kibana dashboard, which is what the Operations team needs. However, storing years of data in Elasticsearch would be incredibly expensive. Google Cloud Storage (GCS), on the other hand, is extremely cheap for long-term storage but far too slow for a live dashboard. By using both, we got the best of both worlds: performance where we need it, and cost-savings where we don’t.
2. Managed vs. self-hosted (Docker vs. the cloud): Why did we use Docker locally?
We ran Kafka and Elasticsearch locally using Docker, which gave us full control and was free for development. In a real company, we would almost certainly use a managed service like Confluent Cloud or Elastic Cloud. The trade-off? We would pay more money to save our engineers’ valuable time on setup, maintenance, and scaling. As a PM, understanding this “Build vs. Buy” trade-off for infrastructure is critical, as it directly impacts your team’s velocity and your product’s total cost of ownership.
High-level lessons for product managers
After building this platform from the ground up, here are the four biggest lessons I’m taking with me:
1. Build a “tracer bullet” MVP First. Don’t try to build the entire complex system at once. Start with the simplest possible end-to-end flow (the producer-to-consumer test) to de-risk your core assumptions early. This tells you if your foundational ideas are even technically feasible before you invest significant engineering effort.
2. Architect for your users’ needs (separate “fast” and “slow” data). Recognize that different users have different data needs. The Ops team’s need for a live dashboard is fundamentally different from the Strategy team’s need for deep analytics. Design your data architecture to serve these distinct personas, even if it means creating parallel data paths.
3. Treat your data pipeline as a product. It has a backlog (new data sources or transformations), users (analysts, other services), and requires an orchestrator (Airflow) to function. Applying product management principles like defining user needs, prioritizing features, and ensuring reliability to your data infrastructure leads to more robust and valuable outcomes.
4. Master the art of the analogy. You don’t need to be a distributed systems engineer to lead a technical product. By using simple analogies (the orchestra conductor, the digital nervous system, the warehouse analyst), you can have deep, meaningful conversations with your engineering team about complex architectural trade-offs and their impact on the product. It’s the most powerful tool a PM has for bridging the gap between product and engineering.
Beyond the black box
And there we have it. From a single JSON message sent into the void, we’ve constructed a complete, end-to-end data platform. We successfully solved our initial user problems, delivering both a live operational dashboard for our “Now” persona (the Operations team) and a real-time analytical query powered by a machine learning model for our “Why” persona (the Strategy team).
This project was never just about the technology. It was about demystifying the “black box” that so often separates product vision from engineering reality. We learned that the real product isn’t just the K-Means model that finds geographic clusters; it’s the resilient, scalable, and observable platform that allows that model to deliver value, second by second, in a production environment.
As product managers, our role isn’t to write the code, but to understand the architecture, guide the trade-offs, and define the “why” with enough technical fluency to inspire and unblock the “how.” By embracing the process, even the failures, we transform complex systems from intimidating diagrams into a series of logical, product-led decisions.
The gap between a model in a notebook and a production-ready AI feature is no longer a black box: it’s a series of well-defined iterations. The only question left is: what will you build?